PORTFOLIO SIX: Communities

Portfolio six “COMMUNITIES” is published by Paulson Fontaine Press in Berkeley, CA. Portfolio six updates and reimagines 2 original Du Bois data portraits within the group of works. The Communities portfolio focuses on aspects of Black communities offering insights into the dynamics that repair, sustain and build our Black communities and ongoing challenges therein.

William Villalongo and Shraddha Ramani, Black Interstate Migration by Region, 2025. Color aquatint with chine collé. 28 x 22 in. Edition of 20. Printed and published by Paulson Fontaine Press, Berkeley, CA. © Villalongo Studio LLC. Courtesy William Villalongo, Shraddha Ramani and Paulson Fontaine Press, Berkeley, CA.

BLACK INTERSTATE MIGRATION BY REGION

Black Interstate Migration by Region correlates a number of recent reporting by Brookings, The Guardian and The Washington Post that have exposed a “New Great Migration,” a reference to the historical “Great Migration” at the turn of the 20th Century. We pull data from the American Community Survey 2023 and IPUMS USA that validate these claims. From the early 1900s until the 1970s, Black people moved to northern cities from former slave states in the American South in massive numbers looking for job and education opportunities, evading Jim Crow laws and lynchings. By mapping the interstate migration flows of Black people by region one can see the larger volume flows from all regions moving to the south, including a large number of people from the south choosing to move within the region. In our artwork the data is clear the largest migration flows represented by colorful bands move from the West (pink), Midwest (yellow) and Northeast (green) move into the South (blue).

William Villalongo and Shraddha Ramani, Prison Labor Wages by State, 2025. Color aquatint, spitbite aquatint and softground etching with chine collé. 28 x 22 in. Edition of 20. Printed and published by Paulson Fontaine Press, Berkeley, CA. © Villalongo Studio LLC. Courtesy William Villalongo, Shraddha Ramani and Paulson Fontaine Press, Berkeley, CA.

PRISON LABOR WAGES BY STATE

Prison Labor Wages by State reimagines Du Bois’s original data portrait titled, “Proportion of Freemen and Slaves Among American Negros.” In his original work Du Bois is tracking arguments in the institution of Slavery in the U.S. by showing the recorded freemen and slave populations. Starting at 1790 when the Pennsylvania Society lead by Benjamin Franklin presented a petition to the First Congress urging them to take action against slavery. The timeline ends at 1860 representing the last years of the American Civil War which ended with the abolition of slavery as the law of the land through the 13th Amendment. We pick up from here by invoking the 13th Amendment and the living legacy of slavery in the form of the American Prison-Industrial Complex. The 13th Amendment itself makes clear the carceral system would be the new front for slavery in the U.S. Our work focuses on comparing the Federal Minimum Wage (black) to prisoner wages (DOC orange) though its various work programs. This reveals quite clearly that the crux of arguments for slavery has always been about slave labor vs. free labor and is the main legislative concession to the Confederates within the amendment after their “Lost Cause.” Currently, California Assembly women Lori Wilson intends to introduce a new anti-slavery amendment, for the state’s 2026 ballot which would challenge prison labor practices.  


The 13th Amendment: “Neither slavery nor involuntary servitude, except as a punishment for crime whereof the party shall have been duly convicted, shall exist within the United States, or any place subject to their jurisdiction.”

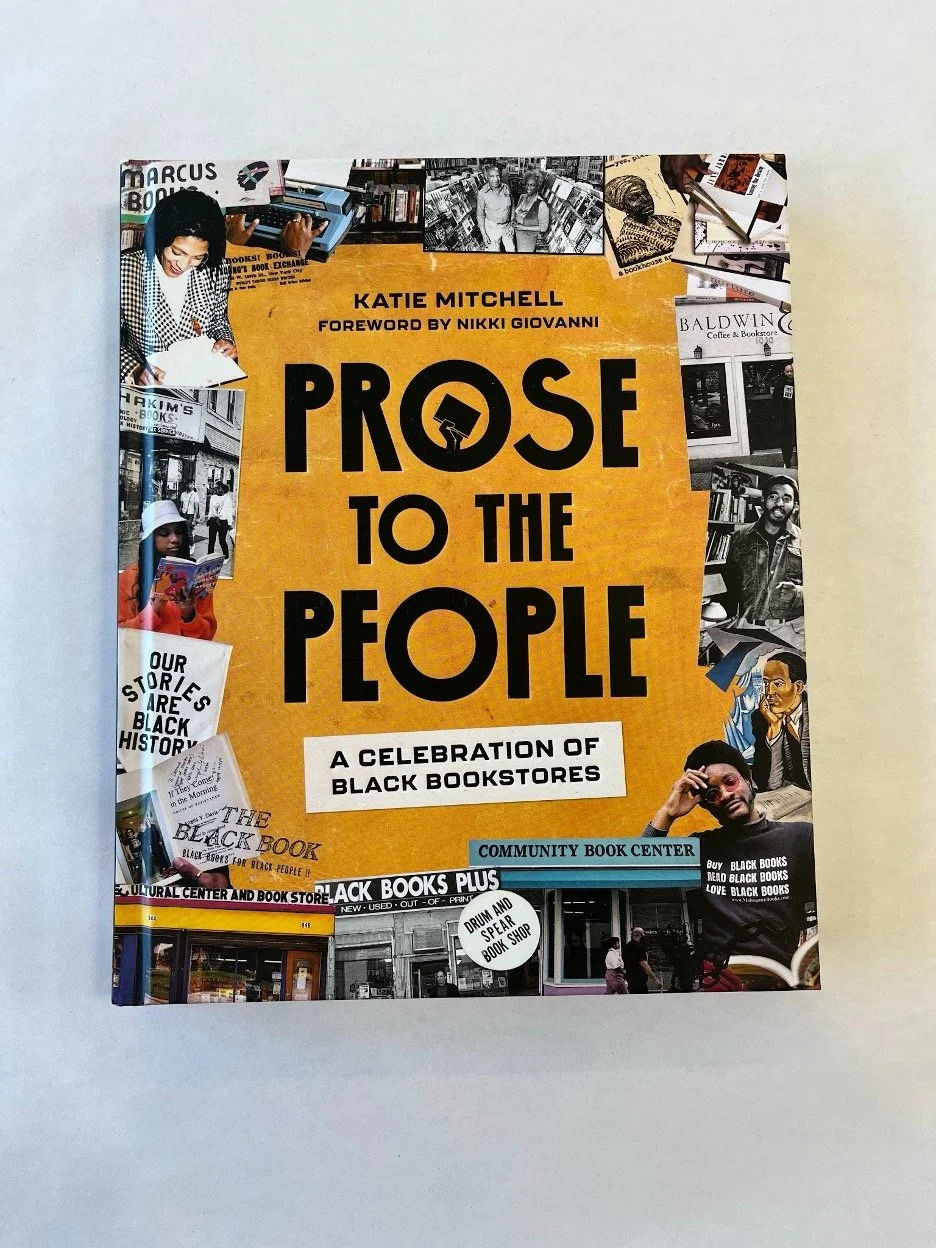
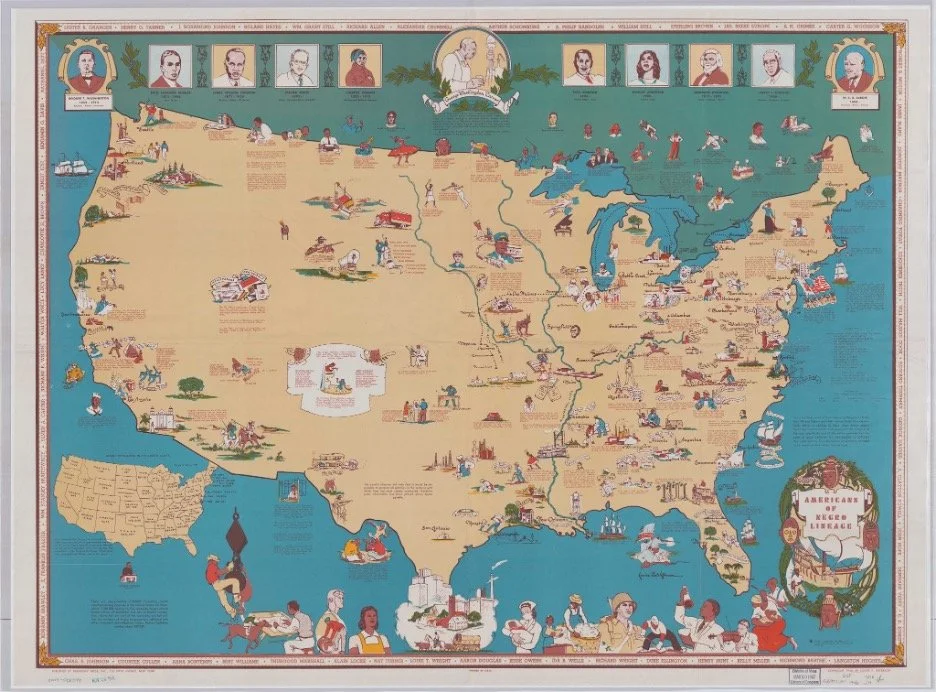
William Villalongo and Shraddha Ramani, Black Bookstores in the United States, 2025. Color aquatint and softground etching with chine collé. 28 x 22 in. Edition of 20. Printed and published by Paulson Fontaine Press, Berkeley, CA. © Villalongo Studio LLC. Courtesy William Villalongo, Shraddha Ramani and Paulson Fontaine Press, Berkeley, CA.

BLACK BOOKSTORES IN THE UNITED STATES

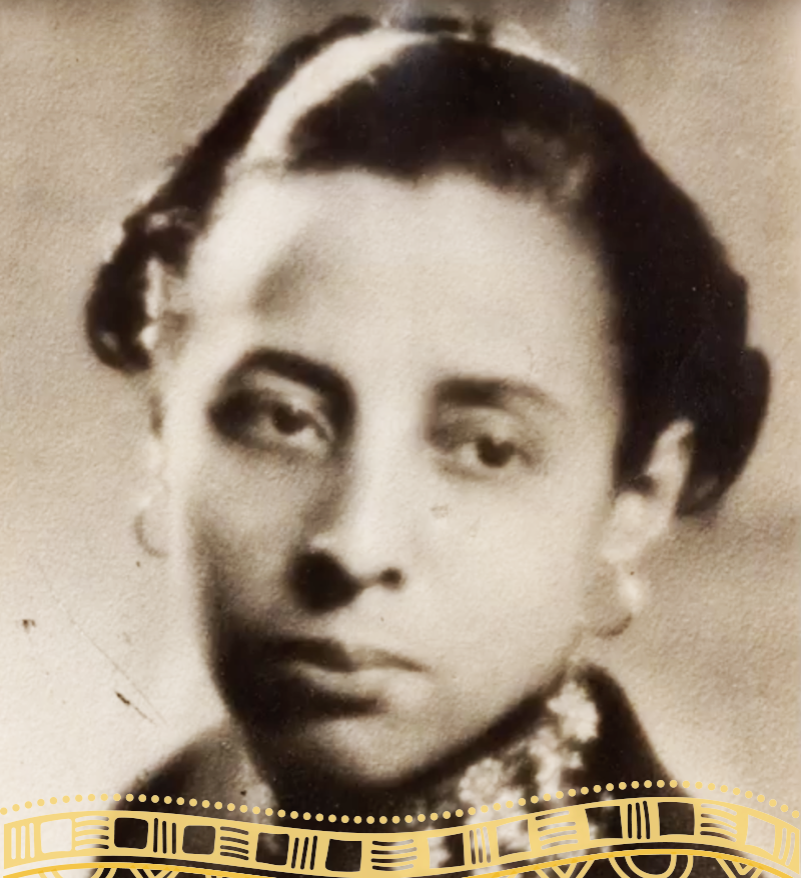
Black Bookstores in the United States brings focus to the longstanding tradition of Black Bookstores as cornerstones of Black communities across the united states by mapping their locations. In this visualization we highlight the work of two visionary women one historic and one living. The data which maps current and some historic bookstores across the U.S. comes from Katie Mitchell’s Prose to the People: A Celebration of Black Bookstores. Prose to the People is a collects historical and contemporary stories on the phenomenon of Black Bookstores and there locations. It offers beautiful moments of poetry throughout and features a forward by Nikki Giovanni. 

The look of our bookstore map stands out from all the data portraits we have made because it approximates the design aesthetic of historic cartographer Louise E. Jefferson. Jefferson was one of the first Black women cartographers working in the early half of the 20th century and a fixture of the Harlem Renaissance community of artists. 

As we encountered the visionary and sensitive works of these two women we knew immediately that pairing them within a data portrait was the only logical way to see Black bookstores in the U.S. Jefferson’s historic work has added to the development and awareness of Black history through her groundbreaking work in cartography, while Mitchell’s collection of Black bookstores underscores Jefferson’s work by offering an important chapter to Black literary histories.

William Villalongo and Shraddha Ramani, Black LGBTQ+ Population in California, 2025. Color aquatint and softground etching. 28 x 22 in. Edition of 20. Printed and published by Paulson Fontaine Press, Berkeley, CA. © Villalongo Studio LLC. Courtesy William Villalongo, Shraddha Ramani and Paulson Fontaine Press, Berkeley, CA.

BLACK LGBTQ+ POPULATION IN CALIFORNIA

Black LGBTQ+ Population in California is a data portrait which gives an overview of statistics on Black LGBTQ+ life from the California Health Interview Survey and cross referenced with the American Community Survey (U.S. Census). In November 2024 California consecrated marriage equality in its state constitution and repealed Proposition 8, a proposition that would ban same-sex marriage. While the front for LGBTQ+ rights has moved past marriage equality in recent years, the fight over Proposition 8 was an inflection point as it turned on a Supreme Court decision that declined an appeal to uphold Proposition 8, thereby giving legal precedent for same-sex marriage. While we find the Black LGBTQ+ population to be small portion of the Black community in California their stories and lives are no less important to highlight here. This also becomes reparative in that Du Bois’s original data portraits does not address these Black communities. As we reimagine his original works for the 21st Century, we recognized the significant contributions of LGBTQ+ communities in Black life today. Our portrait references the original “Pride Flag” created in 1978 by Gilbert Baker as commission by local legend, Mayor Harvey Milk. The creation of this artwork incorporates a direct impression of a flag etched into the plate allowing the weave of the fabric to be visible under the colors.

William Villalongo and Shraddha Ramani, African American Burial Ground Project & Tropicana Field, 2025. Color aquatint and softground etching with chine collé. 28 x 22 in. Edition of 20. Printed and published by Paulson Fontaine Press, Berkeley, CA. © Villalongo Studio LLC. Courtesy William Villalongo, Shraddha Ramani and Paulson Fontaine Press, Berkeley, CA.

AFRICAN AMERICAN BURIAL GROUND PROJECT & TROPICANA FIELD

African American Burial Ground Project & Tropicana Field is a visual translation of a living project being done by the University of South Florida’s Heritage Lab led by Antoinette T. Jackson, Phd. We expose the geologic layers of history under Tropicana Field according to the Heritage Lab’s research. Each layer shows the emergence and disappearance of Black communities and their cemeteries which were paved over by consecutive rounds of development. Recent scans reveal remains still interned contrary to official accounts of removal as new luxury housing developments and rebranding of the area’s story takes place. This research by the USF Heritage Lab is ongoing and is revealing more sites in the region where historically Black communities, their stories and ancestors have been erased from official histories even while living in the memories of descendants. Dr. Jackson is also founder and director of the Black Cemeteries Network bringing together professional historians, archeologists and local activists who are recovering lost Black cemeteries across the United States.

PORTFOLIO FIVE: Education

Portfolio five “EDUCATION” is published by Mullowney Printing Company in Portland, OR.Portfolio five updates and reimagines 3 original Du Bois data portraits within the group of works. The Education portfolio focuses on characteristics and challenges for Black learners at the K-12 and College levels in the United States. The portfolio also looks at change makers in Portland’s Black communities. Meanwhile, the portfolio is also home to a living study from Puerto Rico by Isar Godreau and Mariluz Franco.

William Villalongo and Shraddha Ramani, Black College Enrollments 2023–2024 Before & After U.S. Supreme Court Ends Affirmative Action in Higher Education, 2025. Photogravure, soft ground and aquatint etching with chine collé, lithography, and screenprint. 28 x 22 in. Edition of 20. Printed and published by Mullowney Printing Company, Portland, OR. © Villalongo Studio LLC. Courtesy William Villalongo, Shraddha Ramani and Mullowney Printing Company, Portland, OR.

BLACK COLLEGE ENROLLMENTS 2023-2024, BEFORE & AFTER U.S. SUPREME COURT ENDS AFFIRMATIVE ACTION IN HIGHER EDUCATION

In June 2023 the Supreme court effectively ended affirmative action in college admissions, ruling that race-conscious admissions policies at Harvard and the University of North Carolina violated the Equal Protection Clause of the Fourteenth Amendment. The decision reverses decades of legal precedent and within the first year led to a dramatic drop in Black student enrollments in higher education. The infographic shows the acute decline in Black and African American enrollments within a sample of nearly 60 schools categorized by their admissions rates in red, white and blue. These lines of demarcation cut across the backdrop of the 1963, “March on Washington for Jobs and Freedom” in which Martin Luther King gave his iconic “I have a Dream” speech. In the image we see the image of the march and dream being redacted along the lines of declining enrollment. The steepest declines are elite schools such as Harvard, MIT and Yale which just a year previously ranked amongst the highest percentages of Black college student enrollments. 

William Villalongo and Shraddha Ramani, Black Children Enrolled in Public, Charter, and Private Schools, 2025. Soft ground etching with lithography and collage. 28 x 22 in. Edition of 20. Printed and published by Mullowney Printing Company, Portland, OR. © Villalongo Studio LLC. Courtesy William Villalongo, Shraddha Ramani and Mullowney Printing Company, Portland, OR.

BLACK CHILDREN ENROLLED IN PUBLIC, CHARTER AND PRIVATE SCHOOLS

This infographic updates Du Bois’s original “Negro Children Enrolled in the Public Schools”. The dawn of Public Schools in the U.S. may have been the only success story of post-Emancipation “Reconstruction”. Du Bois’s original shows a beacon of hope as young Black learners increase significantly over the course of a few decades. The Public School system became the face of arguments over desegregation in the 60s. Today, Public Schools remain the place where the majority of young people of all races receive K-12 education, but in recent decades enrollments are trending down. Many factors account for this. Today Public Schools are the most segregated they have ever been since the Brown vs. Board of Education decision. Challenges in allocating enough funding to public schools and increased competition for those funds with Charter Schools are having a huge impact. For Black families of means, Private Schools are an increasing option to secure a competitive future for their children. However, the rise of Charter Schools is the biggest factor for declining Public School enrollments. Particularly, in cities where Charter Schools are expanding. 

William Villalongo and Shraddha Ramani, Black Teachers in Public Schools By Minority Population, 2025. Photogravure etching with lithography and collage. 28 x 22 in. Edition of 20. Printed and published by Mullowney Printing Company, Portland, OR. © Villalongo Studio LLC. Courtesy William Villalongo, Shraddha Ramani and Mullowney Printing Company, Portland, OR.

BLACK TEACHERS IN PUBLIC SCHOOLS BY MINORTIY STUDENT POPULATION

Across classrooms, schools and communities American students are far more diverse than their teachers. Some 79 percent of U.S. teachers are white compared to 44 percent of students. Studies have shown Black students academic and life outcomes are better when they have a same-race teacher. In fact, some research has shown that being assigned a Black teacher produced better outcomes for students of every race, compared to being assigned a white teacher. The infographic updates two of Du Bois’s original works that focus on populations of Black students and teachers in public schools. In our time, the study of these demographics have deepened beyond the count and have reached into the qualitative aspects of learning exposing fundamental bias in hiring Black teachers and the effects that may have on young learners. The image appropriates the curious ladder like form in the Du Bois entitled, “Illiteracy” which shows a reduction in the percentage of Black illiteracy over time after Emancipation. As basic literacy in the Black community is less severe Villalongo and Ramani propose a question about challenges to thriving for Black communities. At the same time the infographic shows how many black teachers their are, while exposing the challenges they face.

William Villalongo and Shraddha Ramani, Visualizando la Afrodignidad: Distribution of Skin Tones in Text Books Compared to Puerto Ricans, 2025. Lithograpy, relief, and collage. 28 x 22 in. Edition of 20. Printed and published by Mullowney Printing Company, Portland, OR. © Villalongo Studio LLC. Courtesy William Villalongo, Shraddha Ramani and Mullowney Printing Company, Portland, OR.

VISUALIZANDO LA AFRODIGNIDAD: DISTRIBUTION OF SKIN TONES IN TEXT BOOKS COMPARED TO PUERTO RICANS

Isar P. Godreau and Mariluz Franco-Ortiz utilize a color scale to compare skin color representation in Puerto Rico to depictions of skin tones in the island’s elementary school textbooks. They utilize the Jose Caraballo-Cueto and Isar P. Godreau color scale study which makes a compelling argument that the ethno-racial categories provided by the U.S. Census are not representative of how Puerto Ricans see themselves and are inadequate to assess the impact of racial inequalities. When applied to a range of socio-economic characteristics the scale exposes the systemic colorism that has a disproportionate effect on those who are darker-skinned in puerto rico. The Godreau and Franco-Ortiz study entitled, “Examinando Los Libros de Textos de Estudios Sociales en Escuela Elemental en Puerto Rico para la Equidad Racial (2022-2025) is depicted with an illustration of Puerto Rico next to a school girl. Following the gradient reveals the Island sees itself significantly more diverse compared to its representation in elementary books. This brings into focus how early systemic colorism begins to operate in a child’s life.

William Villalongo and Shraddha Ramani, Justice Oregon for Black Lives: Change Makers in Black Communities, 2025. Lithography and relief. 28 x 22 in. Edition of 20. Printed and published by Mullowney Printing Company, Portland, OR. © Villalongo Studio LLC. Courtesy William Villalongo, Shraddha Ramani and Mullowney Printing Company, Portland, OR.

JUSTICE OREGON FOR BLACK LIVES: CHANGE MAKERS IN BLACK COMMUNITIES

Oregon and its capital city Portland have reached national fame for their incredibly low Black populations. Even as systemic racism touches all aspects of life in the 21st Century, this fact still stands out. Historically, this was not always the case. Portland and Oregon like many northern states and cities became a destination for Black migration after Emancipation. Portland, in particular, has a history of thriving Black businesses and communities. Over the course of the 20th Century this would go into a decline of historic proportions. Many factors began to make the state inhospitable to Black families such as Oregon’s “sundown towns”, which some feel remain in subtle ways. The development of Interstate 5 and other large development projects in Portland would claim eminent domain over large portions of Black neighborhoods displacing families and whole communities. Instead of presenting this well known fact as an infographic we chose to inquire about stories of growth and building. After nationwide protests of George Floyd’s murder and the emergence of the Black Lives Matter Movement many cities, states and institutions began evaluating their role in historical anti-Blackness. Albeit underreported, some business leaders and community organizations around the country have been standing up, investing and finding ways big and small to address historical discrimination of Black communities. his infographic highlights local organizations partnering with even smaller orgs to advocate for and develop much needed resources for Oregon’s existing Black communities. Their efforts were emboldened by the “Justice Oregon for Black Lives” initiative created by Meyer Memorial Trust in Portland, OR. The initiative is a $25 million investment and is the largest initiative in the organization’s history. The image shows these collaboratives amongst the stars. It suggest satellites or beacons working to build back Oregon's Black communities.

PORTFOLIO FOUR: Ownership

Portfolio four “OWNERSHIP” is published by Highpoint Editions in Minneapolis, MN. Portfolio four updates and reimagines 5 original Du Bois data portraits within the group of works. The Ownership portfolio focuses on aspects of Black proprietorship offering insights into the wealth gap between Black Americans and others as well as concerns of ownership local to the Twin Cities.

William Villalongo and Shraddha Ramani, Median Net Monetary Worth of Black Families 2001–2022, 2025. Lithograph and collage. 22 x 28 in. Edition of 20. Printed and published by Highpoint Editions, Minneapolis, MN. © Villalongo Studio LLC. Courtesy William Villalongo, Shraddha Ramani and Highpoint Editions, Minneapolis, MN.

MEDIAN MONETARY WORTH OF BLACK FAMILIES 2001-2022

In 1900 there was no data being taken on the financial status of Black families. Du Bois made a sample from a range of towns in Georgia issuing paper surveys door to door to collect this data. As well, the notion of Black generational wealth would not have been possible. Now we can, in some part thanks to the generation Du Bois focused on. At that time Du Bois measured Black wealth by objects of value such as “household and kitchen furniture” as his original is titled. These are objects that would have been significant purchases, well cared for and passed down to younger generations. Today, Black wealth lives within the normative definitions we think of such as savings, investments, equity and assets. We update the original using a national survey conducted by the Federal Reserve. We reimagine Du Bois’s dynamic spiral in the form of a “Golden Ratio” diagram. The Golden Ration is a mathematical ratio found in various natural structures and patterns. What is revealed by our update is the precarious nature of Black wealth as we see it retract in step with recent economic recessions.

William Villalongo and Shraddha Ramani, Debt-to-Asset Ratio of U.S. Families by Race & Ethnicity, 2025. Relief, lithograph, chine collé, and collage. 22 x 28 in. Edition of 20. Printed and published by Highpoint Editions, Minneapolis, MN. © Villalongo Studio LLC. Courtesy William Villalongo, Shraddha Ramani and Highpoint Editions, Minneapolis, MN. 

DEBT-TO-ASSET RATION OF U.S. FAMILIES BY RACE AND ETHNICITY

When considering Du Bois original data portrait “Value of Land Owned by Georgia Negroes” we came to realize that land ownership was the highest value asset and possibly the only asset of real value for some families. We parse this question for the 21st Century within a U.S. economic system that is radically different and for which Black families participate dynamically. We conclude that debt may be the most significant factor in any economic portrait and is particularly important when looking at Black families today where credit and credit worthiness maybe more consequential than actual funds. Our visualization shows how far “underwater” U.S. families are and what they have to buoy them particularly in difficult economic times for all. In the image we see the money bags in Du Bois’s original afloat at sea each accounting for the total assets of families and the water line demarks the severity of debt. The use of wood block relief evokes the turbulent seas of Hokusai’s “The Great Wave of Kanagawa”.

William Villalongo and Shraddha Ramani, Mortgage Interest Rates of Black and White Homeowners, 2025. Lithograph and collage 22 x 28 in. Edition of 20. Printed and published by Highpoint Editions, Minneapolis, MN. © Villalongo Studio LLC. Courtesy William Villalongo, Shraddha Ramani and Highpoint Editions, Minneapolis, MN.

MORTGAGE INTEREST RATES OF BLACK AND WHITE HOMEOWNERS

In our project we see that Black families are increasingly moving out of cities and moving to the burbs. Many are chasing the American Dream of homeownership and more space for their children to play and grow. In many towns in the U.S. historical redlining put a significant barrier to this dream for most Black families. Jim Crow era covenant laws, zoning laws and infrastructure development have all played a part in this. While Black families still struggle through the sometimes obscure hangovers of the past there are clear signs. As we parse this question around challenges to homeownership we see the disparities present within mortgage interest rates. What we find is that on average Black families are paying higher interest rates in order to have the same dream as white families. While the percentage of Black families that outright own their homes is less than than that of white families, the disparity is not extreme. However, the ceiling for white families with mortgages is 7% with the majority paying under 4%. Black families pay rates as high as 8% with nearly half of those with mortgages paying over 4%. The picket fence dissipates to white as the hurdles to the dream get higher. We bring back the specter of the red line to imply historical challenges anew.

William Villalongo and Shraddha Ramani, Black Owned Business in the Twin Cities, 2025. Lithograph, screenprint, and collage. 22 x 28 in. Edition of 20. Printed and published by Highpoint Editions, Minneapolis, MN. © Villalongo Studio LLC. Courtesy William Villalongo, Shraddha Ramani and Highpoint Editions, Minneapolis, MN.

BLACK OWNED BUSINESSES IN THE TWIN CITIES

Black Owned Businesses in the Twin Cities is an update Du Bois’s original “Negro Buisness Men in the U.S.” by way of an activist project in the Twin Cities. The MSP BIPOC Business Map is a website and open source map allowing users to find minority owned businesses in the Twin Cities created by Atharv Kulkarni in 2023. Users can add to the map and Kulkarni has paired this with social media presence on LinkedIn, Instagram and TikTok. The highly successful approach creates a significant sample of BIPOC Businesses that is constantly being updated. Kulkarni started his project as a way to invigorate local BIPOC solidarity initiated by the Black Lives Matter protests in the wake of George Floyd’s murder by the police in Minneapolis in 2020. The image expresses a flourishing of Black businesses in the Twin Cities as it heals from these still resonate events. Villalongo uses his iconic floral motifs to illuminate businesses against MSP geography. Where and what the businesses are reflect the needs and industriousness of its communities. Conversely, where Black owned businesses are not located exposes difficult truths between the hope of Black entrepreneurship and historically underserved Black communities.

William Villalongo and Shraddha Ramani, Characteristics of Black and African American Farmers in Minnesota, 2025. Lithograph. 22 x 28 in. Edition of 20. Printed and published by Highpoint Editions, Minneapolis, MN. © Villalongo Studio LLC. Courtesy William Villalongo, Shraddha Ramani and Highpoint Editions, Minneapolis, MN.

CHARACTERISTICS OF BLACK AND AFRICAN AMERICAN FARMERS IN MINNESOTA

The story of Black farming in the U.S. is one of dramatic decline. Consecutive decades of disenfranchisement from deed theft to being denied subsidies and loans offered to white farmers have pushed Black farming to the margins. When Du Bois made his original “data portraits” Black farming and farm industry work accounted for the largest portion of occupations and land ownership for Black families. The 1990 Farm Bill attempted to address this historical discrimination by including grants and other resources for “minority farmers”. In 2022 the Biden Administration authorized $2 billion in payments to Black farmers intended to address historical discrimination by USDA lending programs. This came as an answer to still unresolved issues in the Pigman v. Glickman settlement, a class action lawsuit against the USDA by Black farmers which was first settled in 1999. These efforts made an impact on some Black farmers, but were poorly implemented leaving many farmers with denied claims and navigating a difficult administrative process. 

Our conversations with local artist and activist Whitney Terrill explored her activism and advocacy for Black and minority farmers and her own experience with being a farmer. This led to considering the various characteristics of Black farmers in the state to get some sense of where they are and what they produce. The image is a typology of Du Bois’s original graphs used to present information on other topics. The vivid color and geometric work of Du Bois is captured and appropriated to make visible what Black farming in Minnesota looks like.

PORTFOLIO THREE: Employment

Portfolio three “EMPLOYMENT” is published by Island Press at WashU in St. Louis, MO. Portfolio three updates and reimagines 5 original Du Bois data portraits within the group of works. The “Employment” portfolio focuses on aspects of the Black workforce offering insights into the dynamics over time that show us how and where Black people participate in the economy. We use this as a opportunity to reflect on the legacies of slavery in relationship to labor as well as similar historic challenges specific St. Louis.

William Villalongo and Shraddha Ramani, Occupations of Black Americans 1900 - 2021, 2025. Screenprint, chine collé. 28 x 22 in. Printed and published by Island Press, Washington University, St. Louis, MO. © Villalongo Studio LLC. Courtesy William Villalongo, Shraddha Ramani and Island Press, St Louis, MO.

OCCUPATIONS OF BLACK AMERICANS 1900-2021

Occupations of Black Americans 1900-2021 shows the changing face of Black participation in various occupations since Du Bois’s original work in 1900 until today. The timeline runs from 1900 at the bottom to 2021 at the top. The colorful plumes fluctuate between thick and then as Black participation in each of the eleven categories shifts. This image updates two original Du Bois data portraits which show occupation categories and Black participation nationally and in the state of Georgia.The image is a simple bar chart that has been manipulated to smooth out the jagged zig-zag of straight lines into curves suggesting colorful flows through time.

William Villalongo and Shraddha Ramani, Average Annual Income and Expenditures of Black Families in the U.S., 2025. Screenprint, chine collé. 22 x 28. Printed and published by Island Press, Washington University, St. Louis, MO. © Villalongo Studio LLC. Courtesy William Villalongo, Shraddha Ramani and Island Press, St. Louis, MO.

AVERAGE ANNUAL INCOME AND EXPENDITURES OF BLACK FAMILIES IN THE U.S.

Average Annual Income and Expenditures of Black Families in the U.S.  is an update of one of Du Bois’s most iconic data portraits which was illuminated by beautiful photographs of Black families and a gold “one dollar” coin. We decided to take a national average given that the data exists now. Without this data, Du Bois focused on Georgia using surveys taken door to door. As we look at the 21st century how Black families divide their income has changed along familiar lines. We see that housing is taking up the greater portion of their income and their is an increased investment in what Du Bois termed, “the higher life.” things such as savings, education and healthcare. As the plastic shopping bag comes to an end in many towns we celebrate the gold and black ones. A sign of financial means in many places, the humble plastic bag is an iconic part of history deserving its rightful as Pop Art.

William Villalongo and Shraddha Ramani, Employment and Income Disparity Between Black Women and Men in the U.S., 2025. Screenprint, chine collé. 22 x 28 inches. Printed and published by Island Press, Washington University, St. Louis, MO. © Villalongo Studio LLC. Courtesy William Villalongo, Shraddha Ramani and Island Press, St. Louis, MO.

EMPLOYMENT AND INCOME DISPARITIES BETWEEN BLACK WOMEN & MEN IN THE U.S.

Employment and Income Disparities Between Black Women & Men in the U.S. shows the income to employment disparities in six professional fields. Since, 1900 there have been considerable strides in Black employment particularly in an expansion of possibilities for employment. However small in number Black people are working across the spectrum occupations. Even so, it is no surprise that Black unemployment remains relatively high to that of other races. Here we decided to focus on Black men and women for a more intimate story in the larger employment story through a series of triangles. The length of each base represents employment while the high of the triangles represent income. Women are represented by a colorful outline and men are represented by a colored fill. The photographic images do not represent data, yet illustrate each occupational category. When we compare these disparities between Black men and women we see interesting trends where one gender may outpace the other within a given field. Some of these are surprising such as the relatively small amount of men hairstylist compared to women make almost double the income or how women outpace men in income and employment in the field of layer, judges, magistrates and other judicial workers.

William Villalongo and Shraddha Ramani, Reclaimed Family Tree: Ancestors Enslaved by Jesuits at St. Louis University and Region 1823-1865, 2025. Etching, aquatint, chine collé. 28 x 22 in. Printed and published by Island Press, Washington University, St. Louis, MO. © Villalongo Studio LLC. Courtesy William Villalongo, Shraddha Ramani and Island Press, St. Louis, MO.

RECLAIMED FAMILY TREE: ANCESTORS ENSLAVED BY JESUITS AT ST. LOUIS UNIVERSITY AND REGION 1823-1865

In 2019, Robin Proudie and members of her family were contacted by researchers from the Slavery, History, Memory, and Reconciliation Project (SHMR)—a joint initiative between Saint Louis University and the Society of Jesus—to study their ties to slavery. The research revealed that SLU enslaved upwards of 70 people between 1823 -1865, many of whom were Robin's ancestors. In response, Robin led other descendants, and a group of allies to form Descendants of the St. Louis University Enslaved, or DSLUE, an organization centered around Remembrance, Restoration, and Repair. Through the SHMR project Robin was able to make a simple family tree going back roughly 4 generations under the categories “Enslaved by the Jesuits/SLU”, “Enslaved by Another” and “After Emancipation”. We portray her reclaimed family tree as a cross section of a literal tree as viewed from above. The trunk holds the original enslaved people from Maryland, sold to the Jesuits at SLU. The branches spur out and around with each consecutive generation.

William Villalongo and Shraddha Ramani, "Sites of Wounding/Sites of Healing" Alternative Atlas: STL, 2025. Screenprint. 28 x 22 in. Printed and published by Island Press, Washington University, St. Louis, MO. © Villalongo Studio LLC. Courtesy William Villalongo, Shraddha Ramani and Island Press, St. Louis, MO.

‘SITES OF WOUNDING / SITES OF HEALING’ ALTERNATIVE ATLAS: STL

We learned many things from scholars in STL and WashU, but the most amplified was the incredible impact of Walter Johnson’s book, The Broken Heart of America: St. Louis and the Violent History of the United States has had on how the city sees itself in various spheres from academia and cultural institutions to current political arguments. Johnson’s book arcs the founding, flourishing and decline of St. Louis as an industrial center of America. It reaches deeply into the geography of the city accounting atrocities and triumphs neighborhood by neighborhood and block to block. It explains how the ghosts of the past live in present STL making what was once a major destination for Black people during the Great Migration one of the most inhospitable places for Black people to exist in the U.S. 

Walter Johnson at Harvard, Linda Samuels and Geoff Ward at WashU developed a cross discipline studio course called, “Alternative Atlas: STL” for WashU in which students mapped the sites in Johnson’s book connecting the current geography and architecture of the city to layers of the past. They labeled them as “sites of wounding” or “sites of healing” and later this data would be pulled into an interactive map which animates points, areas and streets on which these occurrences accumulate over time and space. We present their map as a still image which has all the layers present. Through the process of printmaking we recreate the dissipation of layers through translucency along the map’s timeline of events. We stayed true to their original color scheme which gives one the feeling of hovering over a city at night. While not every data point in “The Broken Heart of America” is connected to Black histories, their stories and the stories of others have impacted the present Black population of STL most acutely. Instead of listing every location our work encourages the viewer to see the city as a complex of emotion and a place to discover Johnson’s book or the Alternative Atlas course project. 

PORTFOLIO TWO: Populations

Portfolio two “POPULATIONS” is published by Powerhouse Arts in Brooklyn, NY. Portfolio two updates and reimagines 4 original Du Bois data portraits within the group of works. The Populations portfolio focuses on aspects of the Black demographic in the U.S. It offers insights into where we are currently and historically and how we are visible in the larger U.S. and its colonies.

William Villalongo and Shraddha Ramani, Amalgamation of the Black Population with Other Races, 2025. Screenprint and collage. 22 x 28 in. Edition of 20. Printed and published by Powerhouse Arts, Brooklyn, NY. © Villalongo Studio LLC. Courtesy William Villalongo, Shraddha Ramani and Powerhouse Arts LLC Brooklyn, NY. 

AMALGAMATION OF BLACK POPULATION WITH OTHER RACES

This print shows the spectrum of Black identify as recorded in the U.S. Census. The most recent census allow participants to identify with up to 6 race categories thereby, allowing people to express the complexity of their identity. Historically, this has not always been the case. Census categories fluctuate over the years and currently do not satisfy how many American see themselves. Du Bois’s original is limited to Black and white or some now outdated vernacular categories of Blackness such as “brown” and “yellow”. Terms which seem to have migrated to other groups and across colloquial language. We render this spectrum of Black identity as scribble clusters underscoring the amalgamation of identity. In an effort to make Afro-Latinidad visible we also include adjacent red clusters that represent the hispanic ethnicity within the amalgamation clusters. The high gloss and thick lines resemble marks made by an inky marker.

William Villalongo and Shraddha Ramani, Distribution of Black Americans in the United States, 2025. Screenprint and collage. 22 x 28 in. Edition of 20. Printed and published by Powerhouse Arts, Brooklyn, NY. © Villalongo Studio LLC. Courtesy William Villalongo, Shraddha Ramani and Powerhouse Arts LLC Brooklyn, NY.

DISTRIBUTION OF BLACK AMERICANS IN THE UNITED STATES

This print is a simple, but effective visualization of where Black people live in the U.S. and its territories. Like a starry night, sparkling colored hexagons sit against the black background like jewels in a velvet box. The viewer reads the data with the brightest and biggest shapes representing higher density populations and the smaller dimmer twinkles representing lower density populations.

William Villalongo and Shraddha Ramani, City, Suburban & Rural Population 2020, 2025. Pigment print and collage. 28 x 22 in. Edition of 20. Printed and published by Powerhouse Arts, Brooklyn, NY. © Villalongo Studio LLC. Courtesy William Villalongo, Shraddha Ramani and Powerhouse Arts LLC Brooklyn, NY.

CITY, SUBURBAN & RURAL POPULATION

At the turn of the 20th Century Du Bois rightfully predicted and evidenced in his data portraits that cities would become central to Black populations in the U.S. due in large part to the Great Migration. In the 21st century that has shifted dramatically to Black populations increasingly moving toward suburban areas. A category that did not exist in 1900. There may be no greater marker of modernity than the suburbs. Indeed, since this phenomenon began in the middle of the 20th Century it has become iconic of the “American Dream” with white picket fences and perfectly maintained lawns. It has also come at a great cost to historically Black areas in cities which were paved over by highway systems to connect the burbs to cities, nearly decimating small town economies in rural America. Now, many factors contribute to the increasing Black suburbanization from higher incomes for some Black families to increasing rates of gentrification in cities making them unaffordable. We updated the iconic spiral used by Du Bois to suggest an unraveling of what used to be the City/Rural divide. The decorative graphics within our spiral suggest wallpaper designs, yet another staple of suburban life.

William Villalongo and Shraddha Ramani, Black Elected Officials Representing Brooklyn, 2025. Screenprint. 28 x 22 in. Edition of 20. Printed and published by Powerhouse Arts, Brooklyn, NY. © Villalongo Studio LLC. Courtesy William Villalongo, Shraddha Ramani and Powerhouse Arts LLC Brooklyn, NY.

BLACK ELECTED OFFICIALS REPRESENTING BROOKLYN

The first half decade of the 21st century has ushered in an increase of Black elected officials in Brooklyn. As Eric Adams mayoral first term comes to a close, he is only the second Black Mayor of NYC; preceding David Dinkins over 30 years ago. In times past, as we go down the ballot across the boroughs one can find Black officials; many firsts to hold seats. For Brooklyn, the example of Shirley Chisolm looms large and we see how her legacy and energy has flourished in 21st century Brooklyn. Brooklyn has perhaps the largest Black population in NYC and it goes to follow it is one of the highest in number of Black elected officials. We reproduce this phenomena as a sample ballot that has been filled out and ready to be submitted. The silvery graphite scribble in the head count representing each Black official in the various categories of seats across federal, state and local government that represent Brooklyn.

William Villalongo and Shraddha Ramani, Visualizando la Afrodignidad: Skin Color & Race in Puerto Rico, 2025. Screenprint. 28 x 22 in. Edition of 20. Printed and published by Powerhouse Arts, Brooklyn, NY. © Villalongo Studio LLC. Courtesy William Villalongo, Shraddha Ramani and Powerhouse Arts LLC Brooklyn, NY.

VISUALIZANDO LA AFRODIGNADAD: SKIN COLOR & RACE IN PUERTO RICO

This print makes visible a study by Jose Caraballo-Gueto and Isar P. Godreau which makes a compelling argument that the ethno-racial categories provided by the U.S. census are not representative of how Puerto Ricans see themselves and are inadequate to assess the impact of racial inequalities. To determine who is more or less vulnerable to racial discrimination, they use a skin-color scale. When applied to a range of socio-economic characteristics the scale exposes the systemic colorism that has a disproportionate effect on those who are darker-skinned in Puerto Rico. This visualization compares U.S. Census categories against the color-scale. This comparison makes visible the disparities between skin color and race categories. It upends easy corroleries of skin color to race in the American racial imagination. We also see that over a third of the population identifies as “Other” suggesting that they do not see a race category in the U.S. Census that makes sense for them. Noteworthy, from the standpoint of skin color, is the “other” category contains the most diverse spectrum of gradient.

The Caraballo-Gueto/Godreau study was conducted as a phone survey as part of the annual U.S. health survey in Puerto Rico. Participants were asked how they see their skin color on a scale of 1-6. Given the highly subjective nature of identification on a color scale we chose to use a gradient to represent the skin color scale. The heavy blood red lines that divide the information highlight the fraught real world dynamics of racism and colorism that happen along these divides.

PORTFOLIO ONE: First Impressions

Portfolio one “FIRST IMPRESSIONS” is published by USF Graphicstudio in Tampa, FL. Portfolio one serves as an introduction to the larger project. Overall the portfolio updates 6 of Du Bois’s original data visualizations over 5 images. We chose these particular visualizations as an overview of the project’s 5 themes Ownership, Employment, Communities, Populations and Education.

William Villalongo and Shraddha Ramani, Black Migration to the U.S. (1/2), 2025. 7-run screenprint with archival pigment print collage. 22 x 28 inches. Edition of 20. Printed and published by Graphicstudio, University of South Florida, Tampa, FL. © Villalongo Studio, Shraddha Ramani, and Graphicstudio, University of South Florida, Tampa. Image courtesy Print Center New York. Photo: Argenis Apolinario.

BLACK MIGRATION TO THE U.S. (1/2)

We reimagine Du Bois’s iconic image of the eastern and western hemispheres of the globe, that trace the paths of the trans-Atlantic slave trade over two images. This is where Du Bois’s famous remarks, “The problem of the 20th Century is the problem of the color-line” would first appear well before his most well known work “The Souls of Black Folk” would be written. In 1 of 2, current Black migration is represented by the black circle & arrow icons in addition to the forced migration from the African continent in red that Du Bois rendered as an image of what diaspora looked like in 1900. We use of the Fuller Map Projection created by Buckminster Fuller. The Fuller Projection shows the size of landmasses in correct portion. By design the Fuller map can be folded into a tetrahedron globe in its flat state the map suggest the interconnectedness and interaction between continents.

William Villalongo and Shraddha Ramani, Black Migration to the U.S. (2/2). 2025. 3-run screenprint, direct gravure with archival pigment print collage. 22 x 28 in. Edition of 20. Printed and published by Graphicstudio, University of South Florida, Tampa, FL. © Villalongo Studio, Shraddha Ramani, and Graphicstudio, University of South Florida, Tampa. Image courtesy Print Center New York. Photo: Argenis Apolinario.

BLACK MIGRATION TO THE U.S. (2/2)

In part two we are showing forced Black migration in America in relation to other Black migration. The blue circles show the increase of the enslaved population in America from 1619 to 1865 and the Black circles represent the increase in other Black migration to the U.S. which we find data for as early as 1850 and we track into 2020. The timeline creates a loop starting at top with 1619 and looping under and back ending at 2020. The loop is significant for us. The data shows a few things firstly that at the height of the slave trade Black people were coming to the U.S. voluntarily for any number of reasons. The other is the complexities of what Black diaspora is within the American context. When we talk about Black America in the 21st Century it is light years away from the picture Du Bois had in front of him, yet the legacies of slavery in America touch all Black lives through the systemic ways it flattens and undermines our lived experiences.

William Villalongo and Shraddha Ramani, Black Homeowners in the States & Territories of the U.S., 2025. 4-run screenprint with archival pigment print collage. 28 x 22 in. Edition of 20. Printed and published by Graphicstudio, University of South Florida, Tampa, FL. © Villalongo Studio, Shraddha Ramani, and Graphicstudio, University of South Florida, Tampa. Image courtesy Print Center New York. Photo: Argenis Apolinario.

BLACK HOMEOWNERS IN THE STATES & TERRITORIES OF THE U.S.

This visualization started as a simple bar chart and as we shaped it in the round the bars became rays emanating from the center like a comic book punch! So we pulled in the Black Power fist to activate it. The story of Black homeownership in the U.S. is not a wholly positive story. However, to the extent that we place todays numbers in relationship to a larger history there are some rays of light in interesting places as the data show. We see that Black homeownership is much higher in the former slave holding states of the American South. It is particularly, high in Puerto Rico. These data bring up questions critical to current discussions around statehood for Puerto Rico, the shifting Black demographics in U.S. cities and states while exposing existing challenges which continue to put homeownership out of reach. We highlight the 5 states where Black homeownership is over 50%.

William Villalongo and Shraddha Ramani, Increase of the Black Population in the United States, 2025. Photogravure, screenprint with archival pigment print collage. 22 x 28 in. Edition of 20. Printed and published by Graphicstudio, University of South Florida, Tampa, FL. © Villalongo Studio, Shraddha Ramani, and Graphicstudio, University of South Florida, Tampa. Image courtesy Print Center New York. Photo: Argenis Apolinario.

INCREASE OF THE BLACK POPULATION IN THE UNITED STATES

Again we start with a simple bar chart. This visualization holds a lot of whimsy yet it is also undergirded with darkness. We use tiny pieces of rope that have been inked and pressed into the paper in place of the straight bars. Each length of rope is 1:1 with the bar chart lengths, however we have used the flexible properties of rope to twist and loop each length asking the viewer to unwind them visually. We consider the multitude of Black life in the wake of chattel slavery and their painful legacies in the 21st century while celebrating the diversity and dignity of Black life. When Du Bois exhibited his “data portraits” in the Negro Exhibition in 1900 most of the Western world thought that without slavery Black people in the U.S. would die out in a generation after Emancipation.

William Villalongo and Shraddha Ramani, Employment by Race, Highlighting Innovative Industries, 2025. 11-run screenprint with archival pigment print and screenprint collage. 22 x 28 in. Edition of 20. Printed and published by Graphicstudio, University of South Florida, Tampa, FL. © Villalongo Studio, Shraddha Ramani, and Graphicstudio, University of South Florida, Tampa. Image courtesy Print Center New York. Photo: Argenis Apolinario.

EMPLOYMENT BY RACE AND INDUSTRY, HIGHLIGHTING INNOVATIVE INDUSTRIES

What appears to be a colorful abstract painting is really a bar chart. There are 5 major vertical bars that correspond to racial categories from left to right. Each bar is segmented with colors that represent an industry. Within these segments of industry we highlight the proportion of that industry that represents “innovative industries” with a clear gloss overlay. Some colors are silkscreen and some are impressions of wood block or spit bite etching that are cut to form and collaged to achieve the seamless butting of colors and bars. We also took license to reshape the square segments to push the form further from a simple bar chart. The term “Advanced Industries” is taken from a Brookings Institute study published in 2015, “America’s Advanced Industries: What Are They?, Where Are They? and Why Do They Matter?” At the time Du Bois made his data portraits there were few major industries being tracked by the U.S. Census than are today and of those Black people found themselves employed in about 6. There are now hundreds of industries for which Black employment is significant. Given that level of granularity we consolidate these down to 9 for the sake of being legible. Additional considerations is the diversity of the of the country itself. To see a relative picture of Black employment one needs to consider how other race categories compare. Lastly, we incorporate “advanced industries” which account for 21st Century jobs that did not exist for Du Bois. We recognize that Black people account in these tech forward jobs, even while we may see low numbers as result of further systemic issues. Brookings defines these “advanced industries” as having both “a high number of workers in STEM professions and high levels of R&D spending”